How to create agrochemical plan of the farmland
Technological workflow
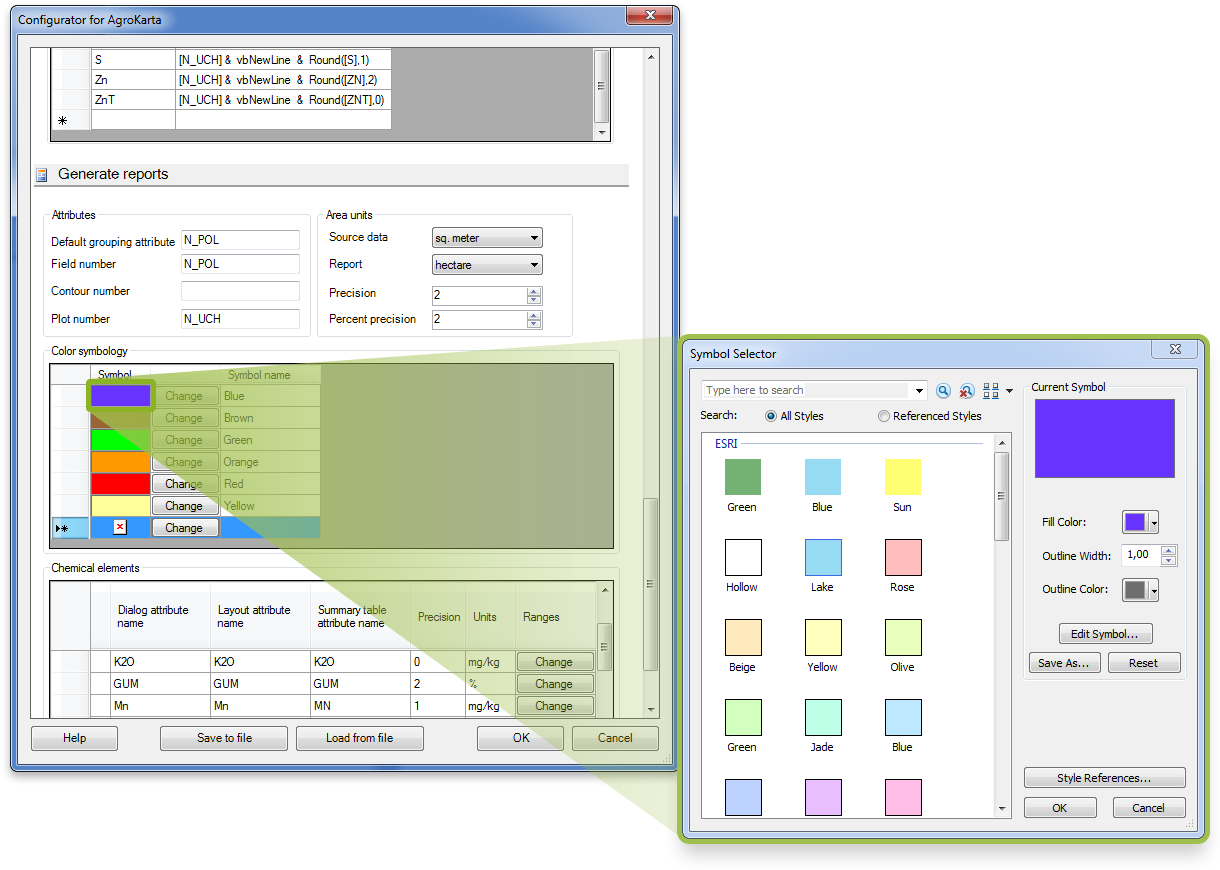
Step 1. Setting configuration parameters
Apparently, agrochemical characteristics of different regions, for example
in Siberia and Volga region may significantly vary.
While preparing maps with AgroKarta some default parameters can be used:
list of chemical elements, soil content ranges, rendering properties, etc.
These parameters can be applied as is or customized based on agrochemical specifics of your region.
Step 2. Separating fields to contours
As a rule, the digitized map of the farmland consists of solid polygons that should be separated
to farming contours. During such separation all superfluous objects (roads, ravines,
forest belts, lakes, buildings, etc.) are deleted from the common farmland layer.
At that there is no need to verify topological accuracy after separation, as objects do not overlap each other.
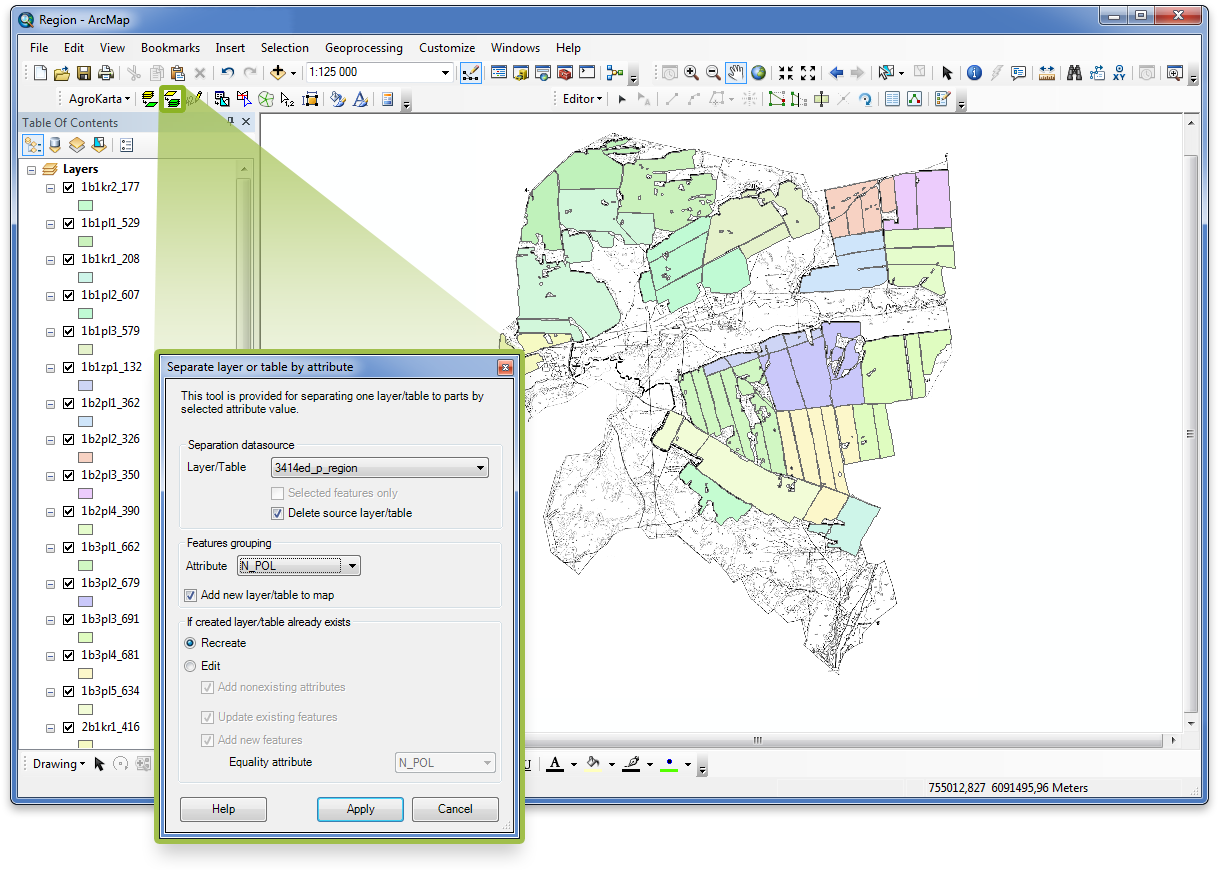
Step 3. Separating single layer with simple plots to layers from different fields
Separation of the common farmland layer to new layers is made automatically
by unique attribute values of the field specified by user, for example “Field number”.
As a result, all contours with the same field names are saved to separate layer.
After separation a set of new layers of simple plots is created
and the source common layer is deleted from the map.
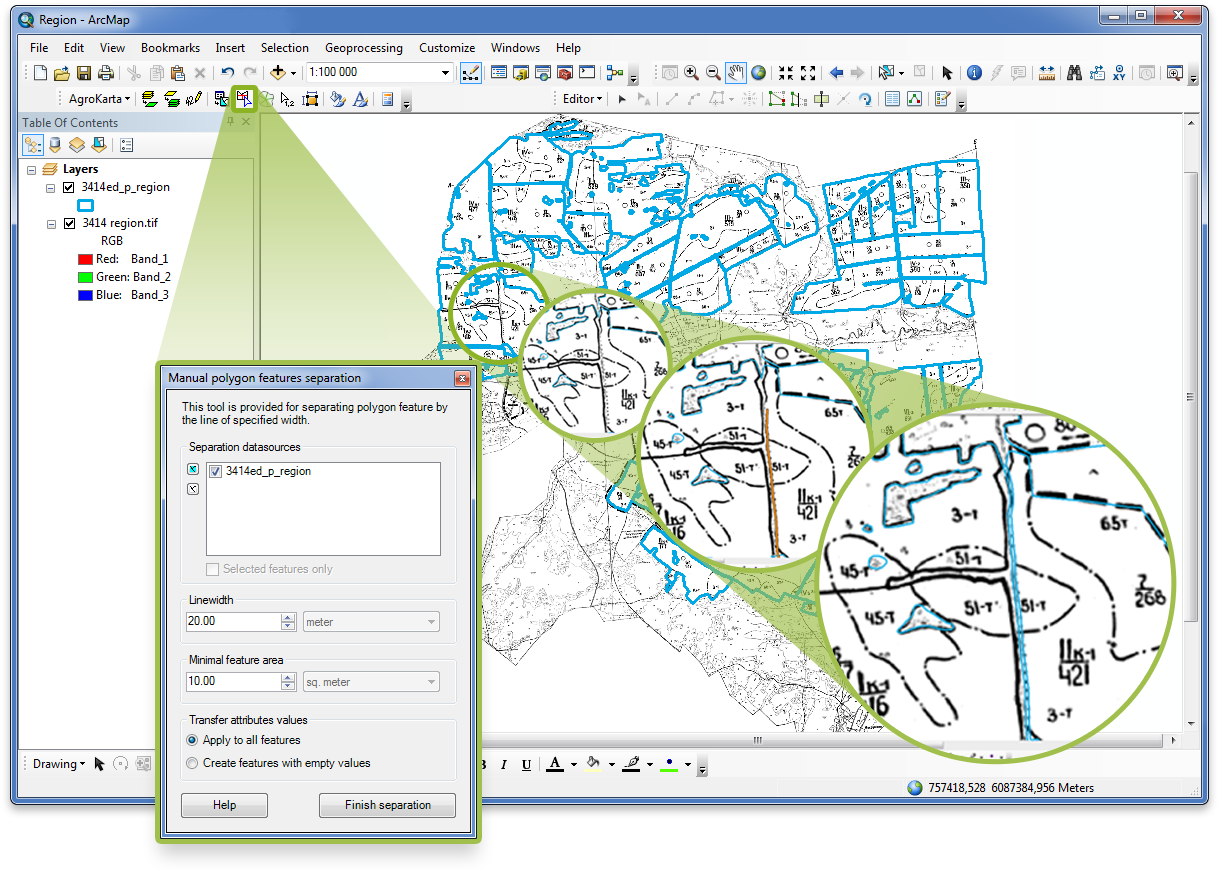
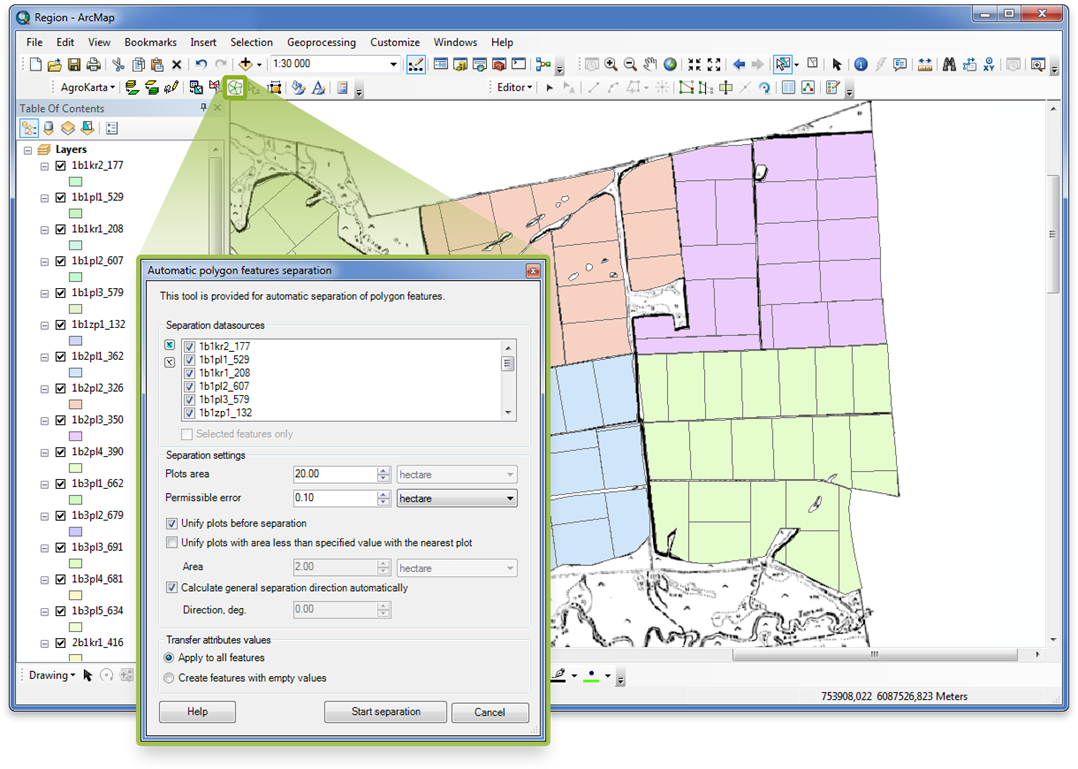
Step 4. Separating contours to simple plots
The contour can be separated to simple plots either manually or automatically.
In case of manual separation, the separating lines are drawn, at that with one such line
multiple polygons from different layers can be separated at a time.
As a result of automatic separation, simple plots of equal area are created.
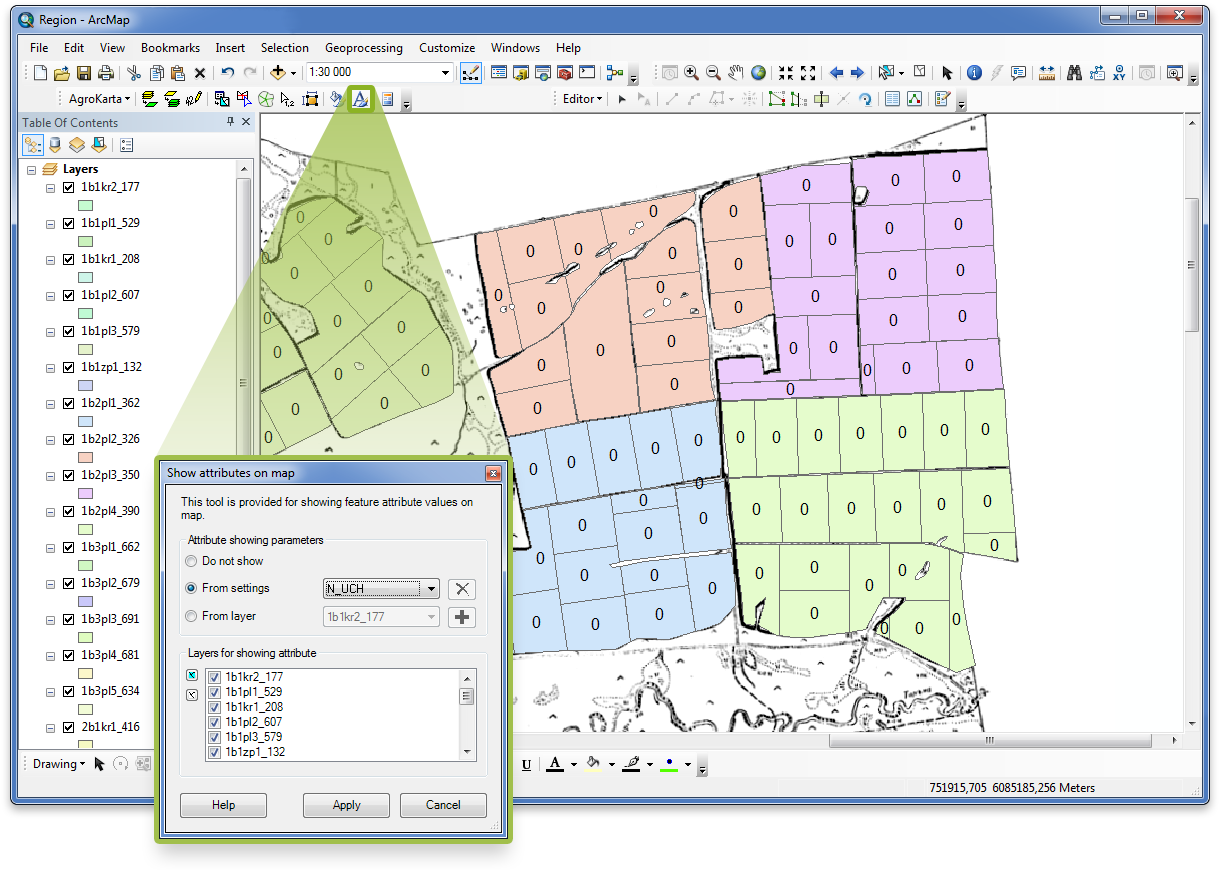
Step 5. Numbering simple plots
Simple plots created after contours separation should be numbered. The plots numbers are assigned automatically based on the specified field value (it is "Plot number" in our case). As now all its values are nulls,
nulls will be shown on the map after you run the separation tool.
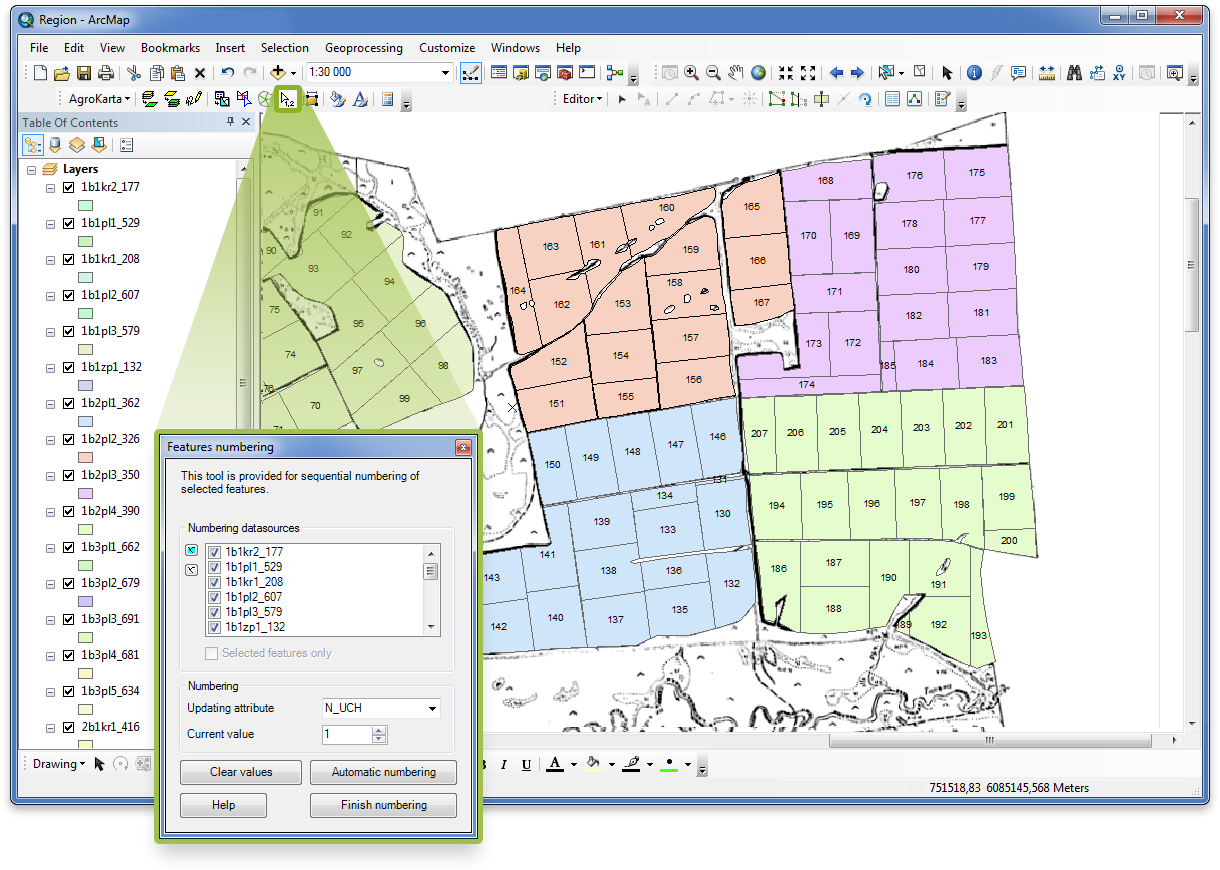
Step 6. Showing plots numbers on map
To show plots numbers on map, either left-click the required
polygon one by one, or press the "Automatic numbering" button.
Assigned numbers will be automatically shown on your map.
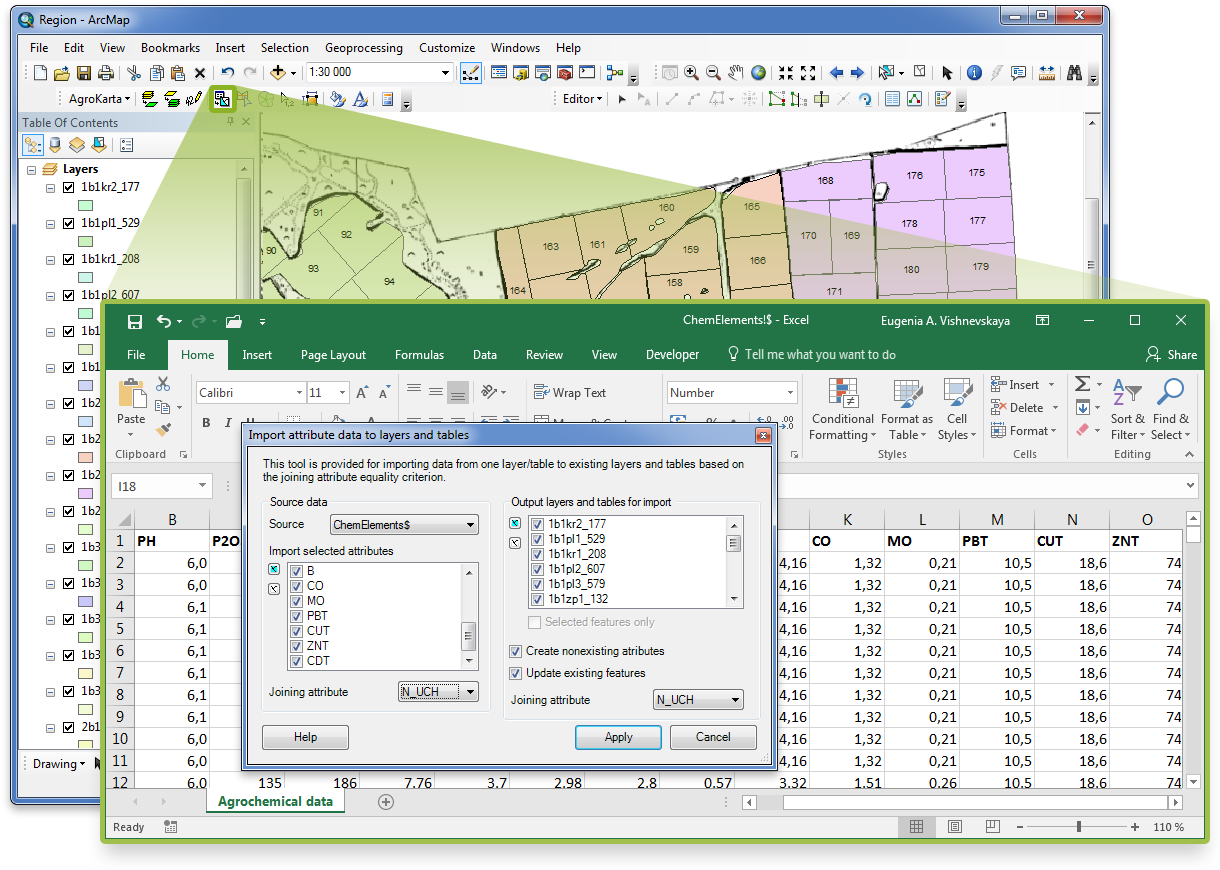
Step 7. Importing chemical elements data
Agrochemical inspection of soils includes evaluation of acidity, content of labile phosphorus, exchange potassium, organic substance, combined acidity, calcium and magnesium, degree of base saturation, as well as
content of microelements, heavy metals and radionuclides.
To get the most relevant information about soils content of plots, the field observation data should be added to map.
Data about chemical elements content taken from .xls tables are added as layer attributes for all plots.
Step 8. Showing data on chemical elements content in soils on map
After importing chemical elements data, values of chemical elements content
in soils can be shown as labels on your map.
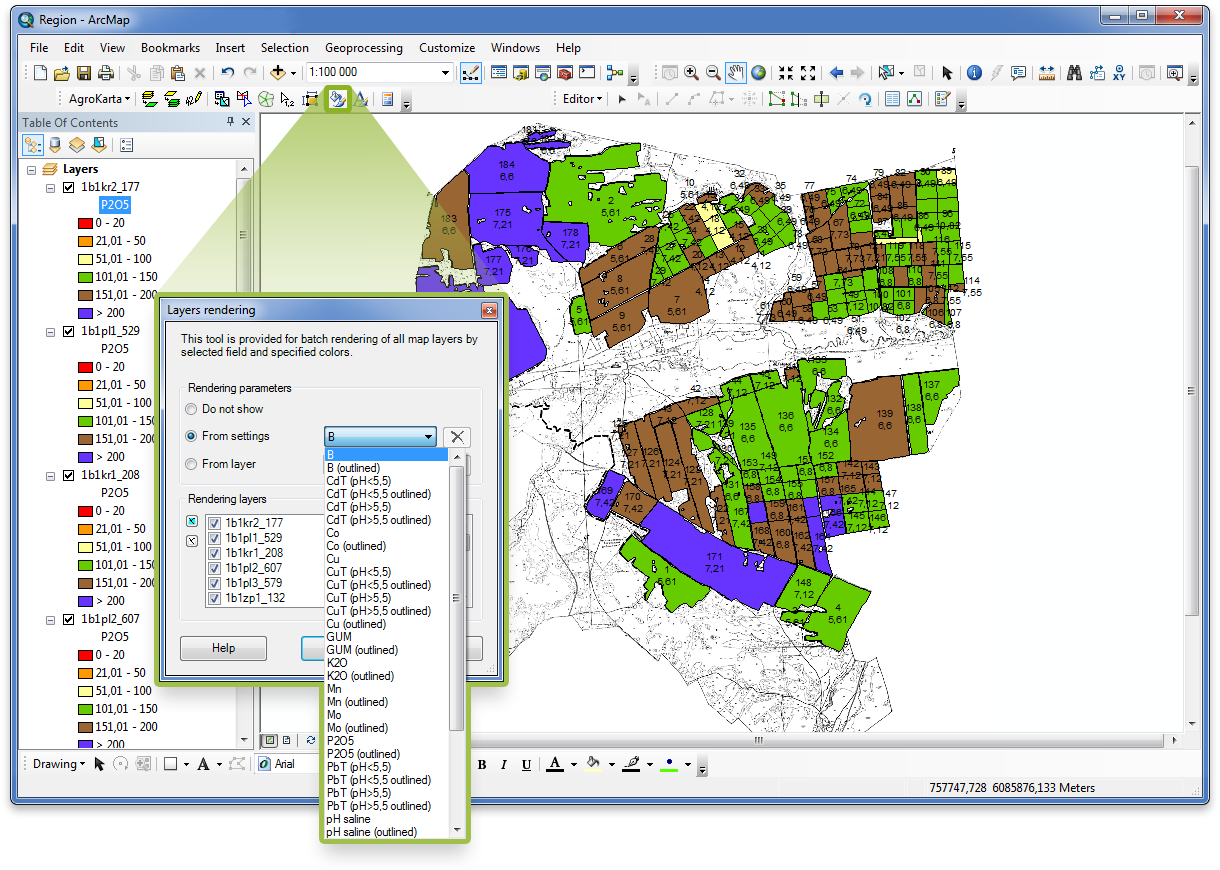
Step 9. Rendering plots by chemical elements
AgroKarta supports several color ranges by chemical elements based on requirements
from the management bodies. All plots are colored simultaneously according to content
of selected chemical element or according to rendering parameters of specified layer.
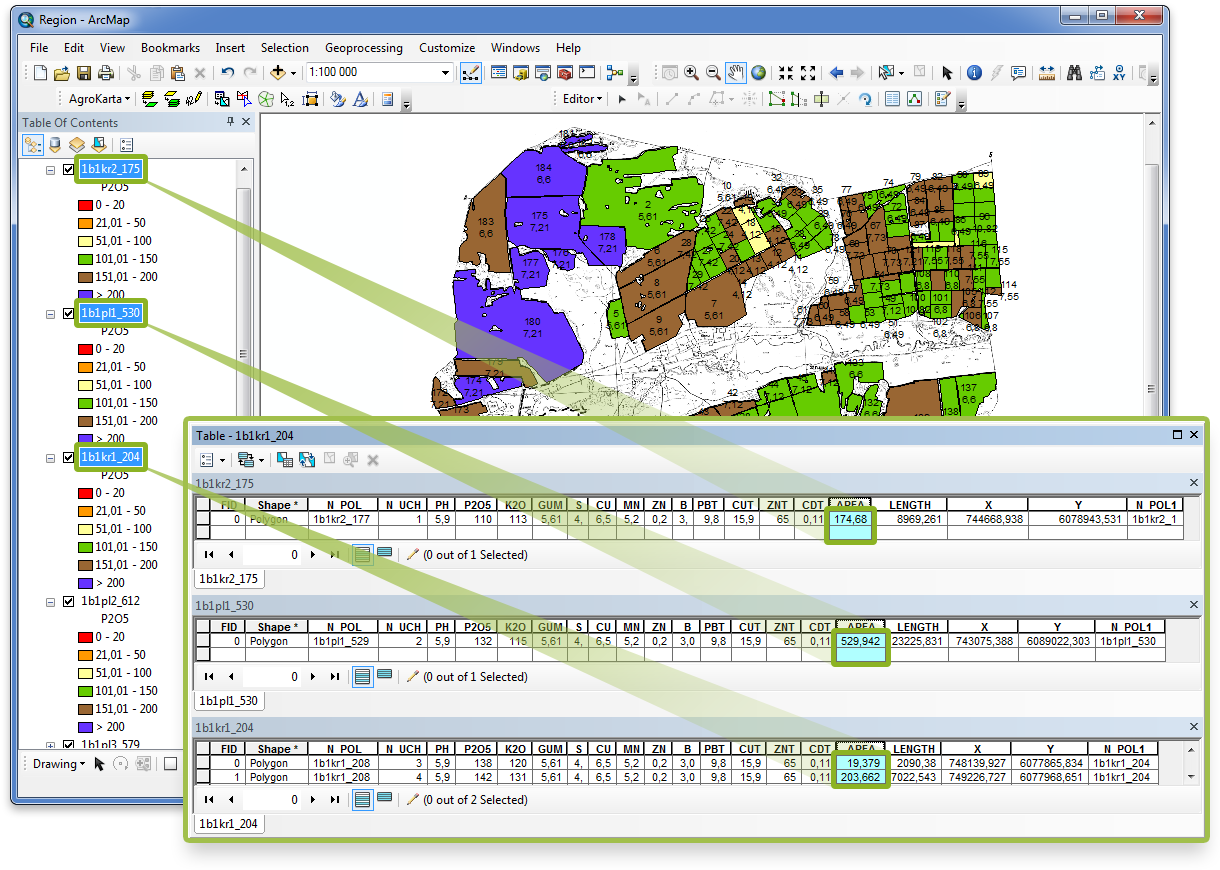
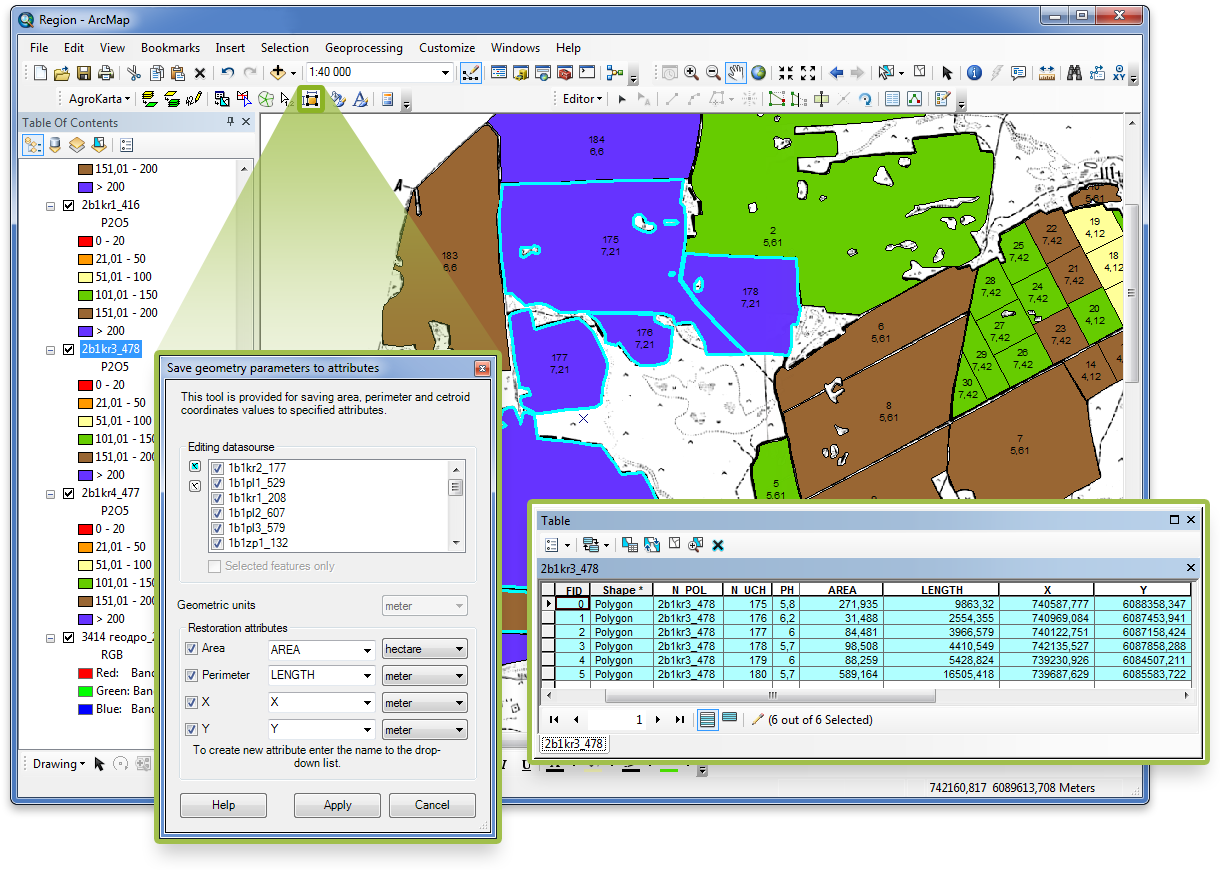
Step 10. Calculating plots area
After separating polygons, some resulted plots can have null or close to null area, so it is quite complicated to find them on the map. This problem can be easly solved with AgroKarta tool provided for adding area value attribute to each plot.
As a result, plots of null area can be promptly found and deleted via attribute table.
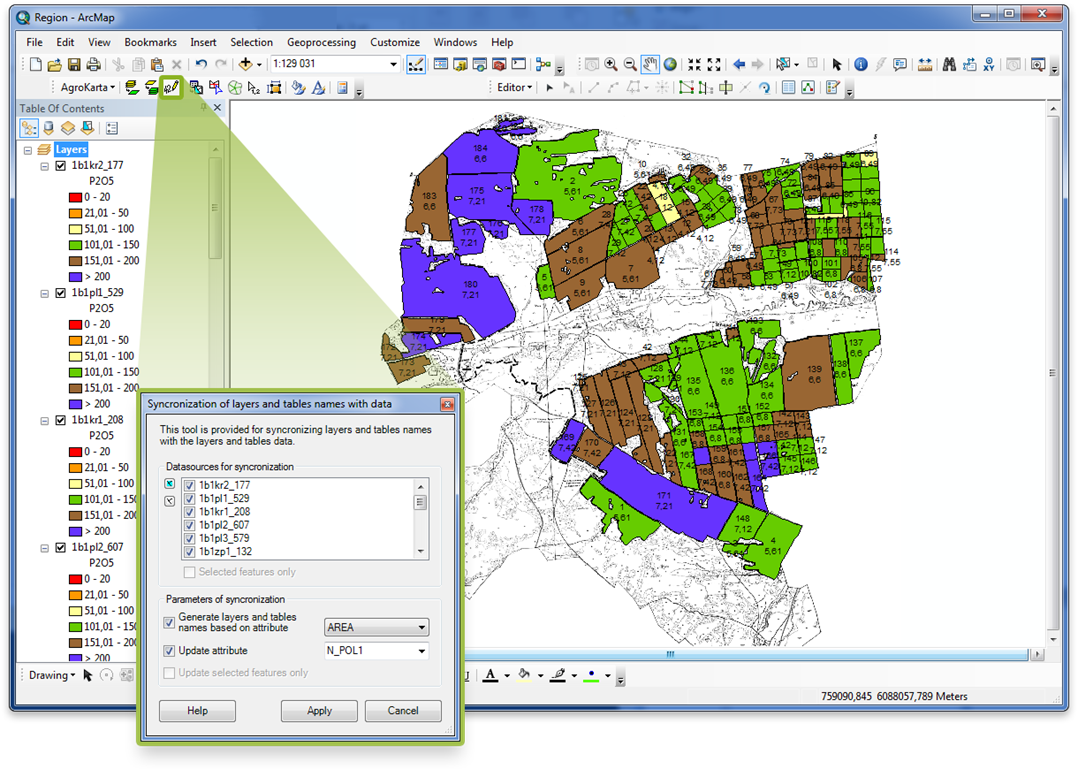
Step 11. Synchronizing layer name with total plots area
The field (layer) name can contain total area value of all simple plots in this field (layer). However, after specifying
the field name, all unusable plots and /or plots of null area may be deleted. So, after deletion of such plots
the field name and the updated total area of the remaining plots should be synchronized.